Tuesday, February 2, 2016

The Ultimate Guide to Facebook Carousel Ads

Facebook carousel ads are extremely engaging and fun way to promote your business.


According to data collected by Kinetic Social, these ads can also drive up to 10 times more traffic to advertisers' websites than static sponsored posts on Facebook. And LOVOO found that they got a 72%higher click-through rate versus single image mobile app ads.


It feels clear these ads can be extremely effective, but how can you maximize their potential? In this post, we'll walk through not just how to create a carousel ad but also how you can get the most out of your ads.


Let's get started.


pablo (11)


What are Facebook Carousel Ads?


The Facebook carousel format enables advertisers, across both Facebook and Instagram, to show 3-5 images, headlines, and links or calls to action in a single ad unit.


You may have spotted them in your newsfeed. Here's how they look on desktop:


carousel-ad


And on mobile:


mobile-carousel


On mobile, users can swipe through the cards while desktop users can maneuver between images by clicking on the left or right arrows.


5 ways you could use Facebook Carousel Ads


Carousel ads are extremely versatile and can be used in a number of ways. While many businesses use this type of ad as a way to promote products, the ads also provide an excellent opportunity to showcase your brand's uniqueness and tell a story.


In this section, I'd love to highlight 5 unique ways you can utilize Facebook Carousel Ads.


1. Highlight a product


Tieks are a specialist ballet shoe maker and used carousel ads to highlight one of the products. Each card of the ad focuses in on one aspect of their shoe, and they used the headline copy to provide more context to each image.


product-highlight


2. Illustrate how to use a product


Tyme Hair used carousel ads to showcase how you can use one of their products. To show how their curling irons worked, they used each card of the ad to share a step with a corresponding image.


use-product


3. Tell a story


Stories are an incredibly effective way of sharing your brands message and engaging with your customers. Project Repat, a company who make quilts out of old t-shirts, have used carousel ads to tell the story of how your memories can transform into a quilt.


tell-story


4. Product tour


In the below example, Music app, Deezer have used carousel cards to give people a taste of the in-app experience before they even download it. Each card of the ad summarized a feature of the app, offering people a good idea of what to expect from the app.


tour


5. Share an article


Carousel ads are an amazing way to share and promote articles. In the below example, Precision Nutrition shared articles from their website on healthy eating for athletes – this ad led to 6,000 new newsletter signups.

article


A quick experiment


We quickly tested Carousel Ads as a way to drive clicks to our content, and it'd be a pleasure to share our results here. Alongside the Carousel Ad, we also tested a Post Engagement Ad to give some context to our results. Here's what we found:


  • The Page Post Engagement Ad had a CTR of 1.05% vs. 0.20% from the Carousel Ad


  • The CPC for the Post Engagement Ad was $0.57 vs. $0.87 from the Carousel Ad.


  • The Post Engagement Ad also generated 79 post likes, 2 comments, 3 shares and 38 page likes on top of the 188 link clicks at 80% of the cost of the Carousel Ad that generated 2 post likes, 0 comments, 0 shares, 155 link clicks and only 1 page like.


Our hunch is that, though it underperformed in this test vs. a Post Engagement Ad, with a little bit of testing and optimization we could improve the effectiveness of the Carousel Ads as a way to drive clicks to content.


An initial thought is that maybe if the first card in the carousel ad didn't quite do it, perhaps another one of the four would. Here's what the first card looked like:


carousel-card


Have you experimented with Carousel Ads as a way to drive clicks to your content? If so, I'd love to hear your thoughts and experiences in the comments below this post.


How to create a carousel ad


It only takes a few simple steps to create a carousel ad, and I'd love to share how you can create these ads from your Facebook Page and also from Adverts Manager.


Let's go!


From your Page


To create a carousel ad from your Page click the ‘Promote' button on the top right corner of the page, and then select ‘Promote your website':


facebook-promote


Next, you'll see an Ads window open up, under the ‘Images' section of this window click the ‘+' button to add multiple cards to your carousel:


facebook-add-image


Once you've added the number of cards you'd like (anywhere from 3-5), you can add an image and headline to each card, and when your ad is looking great and ready to go, fill out the Audience, Budget and Duration fields then hit ‘Promote' to put it live.


Pro tip: If you need to crop an image, click Reposition Image to drag and drop the Crop Image tool onto the part of the image you want to show.


reposition


From Adverts Manager


To kick off a carousel ad campaign from Facebook Adverts Manager, first click ‘Create advert' and then choose either ‘Send people to your website', ‘Increase conversions on your website' or ‘Get installs of your app' from the campaign objective page.


Step 1: Create Advert


create-ad


Step 2: Choose objective


campaign


Step 3: Select audience and budget


ad-budge


Step 4: Select advert creative


This is where you can create your carousel. When you reach the advert creative screen, choose ‘Multiple images in one advert' to build a carousel ad.


carousel-ad


Once you've uploaded your creative, you're good to go and put the ad live.


How to create the perfect carousel ad


Grab attention with the first image


Facebook's Newsfeed is a very busy place, and users are often overloaded with content. To help your ad succeed, pay close attention to the first image and be sure it makes sense on its own and also grabs attention.


A great example of this is Virgin Holidays post about their #DreamBigger sale. The first card on the carousel shows you exactly what they're offering and grabs attention with a powerful image of New York City:


virgin-holidays


Adhere to Facebook's recommendations


Facebook have shared some design recommendations for Carousel Ads. If you're looking to maximize your performance, it could be best to try and stick to these where possible.


Here's a snapshot of their recommendations:


  • Recommended image size: 600 x 600 pixels


  • Image ratio: 1:1


  • Text: 90 characters


  • Headline: 40 characters


  • Link description: 20 characters


  • Your image may not include more than 20% text.


Pro tip: Use the Headline space under each image for product names or benefits, price or percentage off, or a call to action


How to create one long image


Some advertisers choose to break up one big image into cards, to tell a great visual story as the user swipes (or clicks) through them.


Here's an example:

full-width-ad


If you'd like to create an ad in the carousel format that showcases one long image, here's how to do it:


  1. Decide how many carousel cards the image is going to cross (this should be anywhere from 3-5 cards).

  2. Create an image with the correct dimensions. Its height should be 600 pixels, and its width should be 600 pixels multiplied by the number of carousel cards used (ex: a four-card image should be 2400×600 pixels).

  3. Upload this same image for each carousel card, but crop it at equal intervals to divide it up across the cards. Alternatively, you could crop each 600×600 card using image editing software like Sketch or Photoshop before you upload.


Pro tip: Facebook has an option to automatically show the best-performing images first your carousel. If you're creating a long image across multiple cards, it's best to leave this box un-ticked.


carousel-box


6 creative examples of carousel ads


1. Straight Outta Compton


Straight Outta Compton used carousel ads to showcase sections on the film and announce its release on VUDU.


compton


2. Deezer


Deezer turned to carousel ads to announce that The Beatles music is available in their app. The ad features an image of the group spread across three cards and utilized the headline space on each cards to break the news about The Beatles being on Deezer.


deezer


3. Xbox


To promote the latest Tomb Raider game, Xbox used a panoramic shot of character, Lara Croft, hanging on a cliff face.


Alongside the images, Xbox used the cards headlines to tell trail the story of the game. The last cards on the carousel was a link to purchase the game.


xbox


4. Fallout


To promote Fallout 4, Bethesda Game Studios used carousel ads to share ratings and reviews from well-known and trusted games industry websites and magazines.


fallout


5. Tesco


Tesco used carousel ads to showcase a step by step recipe and link back to Real Food blog.


tesco


6. Chipotle


Chipotle used carousel ads as a to drive attention to their ‘Friend or Faux' campaign; the cards compared Chipotle meals with other varieties of fast food to ask which is your friend and which is your faux.


chipolte


Over to you


I hope you found this post useful! I'd love to hear your experience with Facebook carousel ads, both as a Facebook user and advertiser.


What do you think of these ads? Do you find them more interesting and engaging than other types of Facebook ads? As an advertiser, have you found carousel ads effective? How have you used them?


Leave a note in the comments and I'm excited to jump into the conversation with you.


The post The Ultimate Guide to Facebook Carousel Ads appeared first on Social.


How to Upload Large Images in WordPress

Recently, one of our users asked us how they can upload large images in WordPress. Many users see an error when trying to upload larger images in WordPress. This is due to the file size limit. In this article, we will show you how to fix this and upload large images in WordPress.


Large File Size Error


Why You Cannot Upload Large Images in WordPress?


Your WordPress hosting provider may have configured their servers in a way that place a reasonable limit on file upload sizes.


You can see this limit by visiting Media » Add New page.


maximum upload file size in WordPress


If the limit is lower than the file you are trying to upload, then you will see an error like this: ‘ filename.jpg exceeds the maximum upload size for this site'.


Another issue which may stop you from uploading large image files is memory limit.


By default, your WordPress site is allowed to use a reasonable amount of memory. When a script runs for too long and exhausts the defined memory limit, then you will see an error.


If you're encountering either of these errors, then this article will help you fix that so you can easily upload large files to WordPress.


Fixing Image Upload Size in WordPress


If you want to upload large image and media files in WordPress, then here is how you will fix image upload size issue in WordPress.


Simply add this code in your theme's functions.php file.


@ini_set( 'upload_max_size' , '64M' );
@ini_set( 'post_max_size', '64M');
@ini_set( 'max_execution_time', '300' );

This code tries to increase upload maximum filesize, post maxiumum size, and maximum execution time limits for your WordPress site. However, this may not work for some WordPress websites.


In that case, you can try adding this code to your .htaccess file in your site's root folder.


php_value upload_max_filesize 64M
php_value post_max_size 64M
php_value max_execution_time 300
php_value max_input_time 300

If both of these methods fail, then you can try adjusting these values using php.ini file.


The php.ini file is a configuration file used by PHP to define settings. Users on shared hosting, typically don't have access to the main file. However, you can still create an empty php.ini in your site's root folder using an FTP client.


Creating a new file using FTP


Simply add this code in your php.ini file:


upload_max_filesize = 64M
post_max_size = 64M
max_execution_time = 300

Take a look at our guide on how to increase maximum file upload size in WordPress for more information.


Do You Really Need to Upload Large Image Files in WordPress?


Images take more time to load than text. This means that if you have large images files, then it would take longer for your website to load.


Search engines don't like slow websites, and your pages with huge images may not rank high in search results. This would cost you traffic and affect your business goals.


We understand many photography site owners may want to upload high quality images to their site. However, high quality images can be optimized to have reasonable file sizes without losing too much quality.


First we would recommend you to learn how to optimize images for web. You can reduce image file size without having to compromise on quality. You can also bulk resize images from within your WordPress admin area.


Next you should start using Envira Gallery to display images on your website. Envira beautifully displays image galleries without making your website slow. It is incredibly fast, beautiful, and works on all devices. We believe it's the best photo gallery plugin for WordPress.


Many popular websites rely on CDN's to serve static content like images. CDN (content delivery network) serves your images from servers located all over the world. This makes your images and rest of your website load simultaneously. It also improves your site's SEO and user experience.


See our guide on how to install and setup WordPress CDN solution for detailed instructions.


That's all, we hope this guide helped you learn how to upload large images in WordPress. You may also want to see our guide on how to resize and make images larger without losing quality.


If you liked this article, then please subscribe to our YouTube Channel for WordPress video tutorials. You can also find us on Twitter and Facebook.


The post How to Upload Large Images in WordPress appeared first on WPBeginner.

Moz Content Launches New Tiers and Google Analytics Integration

Posted by JayLeary

When we launched Moz Content at the end of November, we limited the subscription to a single tier. At the time we wanted to get the product out in the wild and highlight the importance of content auditing, competitive research, and data-driven content strategy. To all of those early adopters who signed up as Strategists over the last few months, a big thanks.

Since then, we've made a long list of improvements to both Audit performance/stability and the size of our Content Search index. Along with those updates we also added two new subscriptions for larger sites and agencies handling multiple clients: Teams and Agencies. The new tiers not only increase page and Audit limits, but also enable Google Analytics integration with Tracked Audits.

More data for Tracked Audits

For those that aren't familiar, Tracked Audits let you trend and monitor the performance of your site's content over time. On the backend, Moz Content re-audits your site every week in order to discover new pages and update site metrics. This allows you to compare, say, the average shares per article across your entire site from week-to-week or month-to-month.

To date, Moz Content Audits have focused on links and shares. We did that intentionally, since a major goal for the product was to enable the analysis of any site on the web, including competitors. We also wanted to give agencies the freedom to prospect or audit clients without painful integrations or code snippets.

That said (and I'm guessing you'll agree), figuring out your content ROI usually requires a deeper look at site performance.

With Moz Content, we stopped short of a full, conversion-focused analysis suite with custom tracking code and the like. Instead we're focused on a product that delivers content analysis and insights to our entire community of online marketers -- not just the select few that can afford it. Besides, there are plenty of big-ticket tools out there filling the niche, great products like Newscred, Kapost, SimpleReach, and Idio.

So while we're not jumping into the "enterprise" ring (just yet), we did want to give data-driven marketers a leg up in their analysis. The good news: if you're a Teams or Agencies subscriber, you now have the added option of integrating Google Analytics with Tracked Audits.

It's easy to get started, and if you're a Moz Pro subscriber you're probably familiar with the authentication flow. Just go to any Tracked Audit you have GA data for, scroll down to the middle of the report, and click "Connect Google Analytics":

authentication.png

Once you've connected a profile, Moz Content immediately pulls in key metrics for each URL in the Inventory:

inventory.png

You'll probably notice we're only displaying page views in the inventory. While we didn't have the real estate to include all of the metrics we're collecting in the interface, we've added them to the CSV export:

csv.png

Once you dump the data to Excel you'll see the following metrics for the Organic and Paid segments, as well as a rollup of all referrers:


  • Unique Page Views

  • All Page Views

  • Time on Page

  • Bounce Rate

  • Page Value

After we've collected multiple audits, Moz Content also starts trending aggregated metrics so you can get a sense of performance over time:

graph.png

We're hoping this added reporting gets you a step closer to that all-important ROI analysis. Some of you will already have a sense of how much a page view is worth, or the impact of a unique page view on a specific conversion. And for the Google Analytics pros out there, properly configuring Page Value will give you a direct indicator of a page's effectiveness.

This is just the beginning, and we'd love to hear about other ways we could make the GA data more useful. Please reach out and let us know what you think by clicking the round, blue Help button in the lower-right corner of the Moz Content app.

More to come!

We're pushing out code every day to improve the app experience and build on the current features. We're also growing our Content Search index with new sources of popular, trending content. If you haven't tried it for a while, we encourage you to take a second look. Head over to http://moz.com/content and start a search or enter a domain to preview an Audit (be sure to sign into your community account to access both the Dashboard and increased limits).

On the feature front, we're pushing to integrate Twitter data into both the Audit and Content Search. As I'm sure you've noticed, this has been missing in our reporting to date. While we won't have exact share counts for individual articles (see Twitter's decision to deprecate the share count endpoint), we're confident we can provide related information that'll be useful for your Twitter analysis.

As we develop this and other features, we're always on the lookout for feedback from our community. As always, feel free to reach out to our Help team with any issues or feedback about the product. And if you've used Moz Content and are interested in beta testing the latest, shoot us an email at mozcontent+testing@moz.com and we'll add you to the list.


Sign up for The Moz Top 10, a semimonthly mailer updating you on the top ten hottest pieces of SEO news, tips, and rad links uncovered by the Moz team. Think of it as your exclusive digest of stuff you don't have time to hunt down but want to read!

How to prove your mobile site or app will deliver ROI

This article was originally published on our sister site ClickZ, but it's so helpful we thought we'd share it here too.


No mobile project should get the green light until there has been a thorough economic feasibility assessment to evaluate if the potential benefits will exceed the costs of developing, promoting and running it.


Conducting an economic feasibility study, which determines if your mobile site, web app or native app will deliver return on investment (ROI), is a critical stage of the feasibility assessment process.


Even if the technical, operational and schedule feasibility tests outlined in the previous column deliver favorable results, the board is unlikely to invest until they see the economics of the project are proven.


To be persuasive an economic feasibility report must:


  • Detail, quantify, and justify - in financial terms - the benefits of the project.

  • Detail the total costs over the entire lifetime of the project.

  • Calculate when the project will break even.


This should be done for each of the different options for the project e.g. outsource v build yourself; web based v native app.


Noah Elkin, a mobile marketing veteran and co-author of Mobile Marketing: An Hour a Day?


ROI is a metric that generally catches the attention of the higher-ups. If you clearly establish the benefits you expect your strategy or a specific set of tactics to yield, it will be that much easier to justify investment in your efforts from those who control the cash flow. It's a matter of thinking about it from their perspective.


Guides to conducting economic feasibility studies for mobile projects are hard to find - though this infographic by Kona is a useful introduction to mobile app ROI.


But you can apply a mobile interpretation to the methodologies for IT projects such as these by the departments of computer science at University of Waterloo and University of Toronto.


How to establish the benefits of your project


There are three steps to establishing benefits:


  1. Establish the clearly defined goals for the project - these should have been identified and rationalized through stakeholder interviews, customer research and competitor analysis.

  2. Identify the key performance indicators (KPIs) for each goal. These are the metrics against which the success of the project will be measured.

  3. Quantify the value to the firm of these in financial terms - this will be difficult some KPIs, but rarely impossible.


For a customer-facing site or app the goals, KPIs and financial value might be:


Improved brand awareness


KPIs: media mentions; social media mentions.


Financial measurement of value: estimate how much achieving these KPIs would cost through other activates e.g. public relations or advertising.


Improved mobile search results


Increased use of website by mobile devices and reduction in mobile users abandoning site.


KPIs: use web analytics to track the proportion of mobile users on the site, improved time on site; and conversions (e.g. sign-ups, sales).


Financial value: estimate how much achieving these KPIs would cost through other activates e.g. search engine marketing, PR or ads.


Generating footfall instore, to restaurant or event etc.


KPIs: increased store visits attributable to mobile. Attribution is tricky, but trackable through the redeeming of mobile vouchers instore, use of mobile ticketing, and monitoring the use of stock-checker or store finder tool on the mobile site.


Financial value: compare footfall attributable to other media and how much it would cost to generate a similar improvement in traffic e.g. via print or TV ads.


Business leads


KPIs: sign-ups to email and SMS alerts; client use of click-to-call or click-to-email on mobile site to contact company with questions about product or services.


Financial value: as above, compare lead generation attributable to other media and how much it would cost to generate a similar improvement in leads e.g. via print or TV ads.


Sales


KPIs: direct m-commerce sales made via the mobile site; indirect sales instore or online that can be attributed to mobile.


Financial value: for m-commerce, calculate the number of sales made by people using mobile devices, track improvement and compare with total sales; calculating mobiles contribution to sales in other channels, e.g. where a product is researched on mobile, but purchased instore, is harder to attribute and quantify, but far from impossible.


Improved loyalty


KPIs: customer retention; return visits to mobile or physical store; sign-up for loyalty program, email or SMS alerts; mobile traffic to loyalty program site, download of loyalty app; redeeming of mobile vouchers or using repeat-buy discount codes.


Financial value: track increases in the proportion of sign-ups to loyalty program etc. attributable to mobile; estimate the cost of boosting loyalty sign-ups via other media.


The goals and KPIs will be different for an enterprise app. An enterprise app is one that is used internally with a company to "mobilize" its workforce i.e. give them access to corporate applications from the mobile devices.


These are measured in terms of productivity and cost savings for relevant departments: see Kony for more details.


It is also important to establish and track the goals and KPIs of the mobile site or app itself. But unless you are a start-up company where your site/app is your entire business, these should not be confused with the business goals above.


It doesn't matter how many people use you website or app if it delivers no measurable improvement in brand awareness, loyalty, leads and, most importantly, sales.


Goals/KPIs of the website/app include:


  • Volume of regular users

  • User retention

  • Time of engagement

  • Conversions - e.g. signups, sales.

  • Revenue generated from paid app downloads or web/app advertising.


When estimating benefits is important to stay realistic.


Noah Elkin:


If you're a retailer, don't compare usage frequency with Starbucks or time spent with Facebook, because chances are your customers won't need to buy something from your store with the same regularity as they get their daily coffee or communicate with their social graph.


How to establish the costs of your project


It is critical to calculate the entire cost of the project - that is everything from the conception of the project right through to the cost of decommissioning it at the end of its life.


It includes the costs of all criteria technical and operational feasibility tests. All the costs of design, build, launch, running and maintenance costs, scheduled updates, all related wages and training and, arguably the most important, marketing. Gartner calls this total cost of ownership (TCO).


Design and build costs


The costs will be unique to each project, but - big or small - they will share a similar cost structure.


Magnus Jern, president DMI International:


What is the cost of developing a mobile app? This is one of the most common asked questions by clients. The answer is somewhere between zero and $40M. The zero option is using an online app tools such as AppMakr and the $50M could relate to a full enterprise mobility solution.


How much does it cost to develop a responsive website? Assuming like-for-like functionality, the total cost doesn't differ that much from a native app, with the website perhaps coming in a bit cheaper.


How do costs break down? The entire project will usually take up to 5-6 months to the initial release, but this is made up of seven phases. While development will be the largest of these, it terms of time and budget, it will be as little as 40 percent of the cost of the total project.


The phases are:


  1. Discovery and research

  2. Service concept design

  3. Prototyping and design

  4. Technical solution architecture

  5. Development of the app, integration, backend development and setup

  6. Testing and launching

  7. Launch and post launch roadmap.


For each of these phases outlined by Jern you need to estimate the time - and thus budget - to complete all the tasks. In the following chart, Jern estimates the time required for each stage, in the development of a quality app or responsive site.


app development costs


So what does that mean in cash terms?


Magnus Jern:


The rates per category for app development in US or UK are approximately:


  • In-house developer: US$550 / man day (including salary, taxes, insurance, etc.)

  • Contractor: $800 / man day

  • Large system integrator: $800 / man day

  • Premium mobile developer: $1000 / man day


The cost schedule above does not include the operational and promotional costs, which also need to be budgeted for.


Operational costs


Operational costs might include:


  • Appointing and training staff to administer the mobile site or app.

  • Running costs including regular content updates and promotions to keep people coming back.

  • Answering customer queries via email and SMS. Monitoring comments on site and reviews.

  • Maintaining relationships with partners such as content providers.

  • For an internal app, operational costs will include training staff to use the app and help desk.


Promotional costs


Mobile sites, web apps and native apps all need a promotional strategy.


As web properties simply require a user to click a link in search results, email, SMS, social media etc. marketing is less of a challenge for web than native apps, but will still benefit from an investment in search engine optimization (SEO), search advertising, email and social media marketing.


Native apps require the user to visit an app store to download the app to their smartphone (assuming they have the right type of device) which is likely to require considerably more marketing effort than web would.


It is not uncommon to see apps advertised on TV, billboards and print, as well as bombarding mobile users with web and in-app advertising.


Calculate the costs that will be incurred through your go-to-market strategy as you target users through:


  • Owned media - your own website, email and SMS subscribers.

  • Paid media - advertising on search engines, social media, third party websites and apps.

  • Earned media - press, blog and social media coverage.


It is also imperative take into account expenditure on search engine optimization (to improve where your web site/app appears in search results) and app store optimization (to help improve "discoverability" of you native app).


Mick Rigby, CEO of London-based mobile media agency Yodel Mobile:


The majority of mobile app developers reach the end of their development stage, then when they come to deploy the app find they have a huge hole in their marketing budget. The app stores are the most heavily contested marketplaces, so if there is insufficient budget to market and promote the app, it will die without anyone knowing about it.


If you want it to be discovered than yes, 80% of your overall app budget should go into marketing. This isn't just about advertising, it also includes app store optimization and on-boarding as well as social, PR and external CRM.


For mobile websites or web apps you don't need to spend as much on promotion. There's a shorter user acquisition journey and a less competitive marketplace to advertise in. I'd recommend 50 percent of the overall budget.


There is no average spend. It really depends on the category and expectations. For example, to get your native app into the app store top ten for gaming - one of the most competitive categories - you would be looking at investing upwards of ?150,000 ($214,000) a month in mobile advertising in the UK and three or four times that investment in the US.


The go-to-market strategy itself will be looked at in more detail in the next column.


Estimate the life expectancy


Over time all projects deliver diminishing benefits, until eventually they become outdated, irrelevant and unused. Constant refreshing of content and a regular schedule of new versions, will stem this decay, but will not arrest it.


The rate of decay of native applications is particularly severe, due to the intense level of competition from competing apps for the limited amount of space on each user's smartphone.


According to Flurry (2014) one half of native apps lose half their peak users within three months. Some app types have a better half-life than others: news (7 months on average), health, business, communication (all 6 months) and tools apps (5.5 months).


There is no equivalent study for mobile sites and web apps. But assuming a regular flow of new content, a good ranking on search engines and regular enticements to return in emails, SMS, social media and marketing materials, the half-life and thus life-span for a good web site/app should be measured in years as opposed to months.


Calculating the cost v benefit


There are several methodologies for calculating the cost/benefit of your project, two of the easier ones to understand are Payback analysis and Return on Investment (ROI).


Payback analysis


This method calculates when the project will break even.


So, for example the total cost of the project including development, operational, promotion and running costs comes to $560,000 and the project delivers financial benefits of $150,000 in year one, $300,000 in year two, $250,000 in year three and $150,000 in year four.


This project will payback during year three, because by the end of year three the project will have generated $700,000 in cumulate financial benefits, which is greater than $560,000.


As the project has a life expectancy of more than three years, it is economically feasible. If the life expectancy was less than three years it would not be feasible. When comparing different projects or alternatives for the project, a shorter payback period is preferable.


To find the precise break-even point follow the methodology outlined by Castro and Mylopoulos.


Return on investment (ROI)


This method is useful for comparing the profitability over the lifetime of the project between different alternatives e.g. outsource v build yourself; web based v native app. And between this project and others projects that are competing for the same investment funds.


So, if the life expectancy of the project is four years and the total costs over the period are $560,000 and the project delivers $850,000 in benefits over four years the ROI is calculated as follows:


Total benefits - total costs = $850,000 - $560,000 = 52%


Total costs $560,000


Repeat this process for the alternatives and compare which version is the most economically viable.


Note both of the Payback and ROI analysis have been simplified to explain the methodologies. For more in depth studies see Castro and Mylopoulos.


The following table shows how economic feasibility might be reported on feasibility matrix (numbers are for illustrative purposes only):


roi_feasibility_matrix_cz7


What ratio of cost vs reward is the norm? How fast does a website or an app pay off?


Magnus Jern:


Many enterprise apps have a return of investment in as little as three to six months with investments up to $500,000. The reason is simply that the cost savings and productivity increases are huge.


On the other hand most start-ups take at least 12-18 months before their app will break even and they can pay off the initial investment. 85 percent of all start-ups last less than three years which means that they will probably never pay off the original investment.


Next steps


The next stage after completing your economic feasibility assessment is to evaluate your go-to-market strategy.

These will be covered in the next article.


This is the seventh part of the ClickZ 'DNA of mobile-friendly web' series.


Here are the others:


  1. Six mobile strategy questions.

  2. How to identify your mobile audience

  3. Why prioritize mobile-friendly websites and apps

  4. Web apps: advantages of native apps in a web browser

  5. How to test the viability of your mobile project

  6. Assessing the technical and operational feasibility of your mobile project


Andy Favell is ClickZ columnist on mobile. He is a London-based freelance mobile/digital consultant, journalist and web editor.


Contact him via Linkedin or Twitter @Andy_Favell.

Monday, February 1, 2016

How to Add Google Calendar in WordPress

Do you want to add a Google Calendar in your WordPress site? Google Calendar is one of the most useful apps. It allows you to manage your schedule, share events, and organize everything around you. In this article, we will show you how to add a Google Calendar in WordPress.


Adding Google Calendar in WordPress


First thing you need to do is install and activate the Simple Calendar – Google Calendar Plugin. Upon activation, you need to visit Calendars » Settings page to configure the plugin.


Calendar sources settings


First you need to connect the plugin to your Google Calendar. This requires giving the plugin access to your calendar data. For that you need to create and provide a Google API Key.


Simply visit Google Developer Console website and click on create new project button.


Creating a project in Google Developer Console


This will bring up a popup where you need to provide a name for your project. It could be anything you want, but we recommend using something that helps you identify the project.


Choose a name for your project


You will now be redirected to your project dashboard where you need to click on the Enable and Manage API Keys link.


Enable API Keys


You will be brought to a page showing all the Google products and services. You need to click on the Google Calendar API located under Google Apps APIs section.


Enabling Google Calendar API


On the next page, you will be asked to confirm that you want to enable the Calendar API. Simply click on the Enable button to continue,


Enable calendar api confirmation


While your API is now enabled, you still need the details o how you would access the API and what credentials you will be using. Click on the go to credentials button to continue.


Generate API credentials


This will bring you to a page where you need to choose the credentials. We will be using the API key as the credential to connect Google Calendar to WordPress. Click on the API key link to proceed.


Click on API key link to generate API key


You will be now ask to choose where you will be using the key. Since you will be using it on a web server, you need to click on Server key to continue.


choose key type


Finally, you need to provide a name for the key. This could be anything that you can later identify easily. You can leave the IP addresses field blank.


Name your API key


You have successfully created an API key to use with your Google Calendar. Now you can copy the API key and paste it in the plugin's settings page.


Don't forget to click on the save changes button to store your settings.


Making Your Google Calendar Public


If you want to share a Google Calendar, then you need to change calendar settings and make it public. Here is a step by step guide on how to make your Google Calendar public.


Simply go to Google Calendars and click on the drop down icon next to the calendar you want to share.


Sharing a Google Calendar


This will take you to calendar sharing settings. You need to check the box next to make your calendar public and then click on the save button.


Making your Google Calendar public


The last thing you need is to get the unique calendar ID. You will need this ID to display the Calendar in WordPress. Simply click on the Calendar details tab.


Calendar details tab


Scroll down to the calendar address section page. There you will find your calendar ID. You need to copy this ID and paste it in a text file. You will need this calendar ID in the next step.


Copying the Google Calendar ID


Adding a New Calendar in WordPress


You have successfully connected your WordPress site with your Google Calendars. The next step is to add Google Calendar in WordPress.


Simply go to Calendars » Add New page. You will see a screen much like the post or page editing screens in WordPress.


Adding new calendar in WordPress


Start by entering a title for your calendar. You will notice that the plugin has already added some shortcodes and text in the textarea. You can leave that as it is and scroll down to the calendar settings box below the text editor.


You need to click on the Google Calendar tab in the calendar settings box and paste your Calendar ID.


Adding calendar ID in WordPress


You can also click on other tabs in the calendar settings box to customize how the calendar will display on your WordPress site.


When you are done, simply click on the publish button to save your calendar.


Display Google Calendar on Your WordPress Site


The Google Calendar you just created is not visible on your WordPress site yet. You will still need to add the calendar to a WordPress post or page.


Simply create or edit a WordPress post or page. On the post editor screen, you will notice the new ‘Add Calendar' button.


Add calendar button on the post edit screen


This will bring up a popup where you can select the calendar you just added from a drop down menu.


You can also attach a calendar to a post by selecting it from the attach calendar metabox on the post edit screen.


Attach Google calendar to a post or a page


If you want to display your Google calendar in a sidebar widget, then Simple Calendar plugin has a widget for that.


You will need to visit the Appearance » Widgets page and find the Simple Calendar widget in the list of available widgets. Next, simply drag and drop the widget to a sidebar.


In widget settings, you will need to select your calendar from the drop down menu. Don't forget to click on the save button to store your widget settings.


Adding Google Calendar to a sidebar using widget


That's all, you can now visit your website to see your Google Calendar in action. You will notice that the plugin will beautifully highlight your events on the calendar. If you take the mouse over to an event, it will display event details.


Google Calendar embedded into a WordPress page


We hope this article helped you learn how to add Google Calendar in WordPress. You may also want to see our guide on how to install Google Analytics in WordPress.


If you liked this article, then please subscribe to our YouTube Channel for WordPress video tutorials. You can also find us on Twitter and Facebook.


The post How to Add Google Calendar in WordPress appeared first on WPBeginner.

12 fascinating SEM related stats from January 2016

As it's now February, let's take a look back at January's most interesting online stats that will perhaps point you in the right direction for what to expect for the rest of the year.


Here we have everything from display ad spend, ‘peak tech', in-app customer care, data failure, ad blockers to native ads and the true value of brand activity on social.


Nearly half the world is online


And almost one-third of the world uses social media, according to We Are Social’s latest global snapshot.


The key statistics for digital, social, and mobile media in 2016 are:


  • 3.42 billion internet users, equaling 46% global penetration

  • 2.31 billion social media users, delivering 31% global penetration

  • 3.79 billion unique mobile users, representing 51% global penetration

  • 1.97 billion mobile social media users, equating to 27% global penetration


Global-Snapshot-Jan-2016


US display ad spend will overtake search ad spend in 2016


eMarketer revealed that digital display ad spend will surpass search ad spend in the US for the first time ever in 2016. The categories of video, sponsorships, rich media and “banners and other” will account for the largest share of digital ad spending (47.9% – worth $32.17 billion). Within the display category, one in five dollars budgeted will go to “banners and other”


You don’t need that new iPhone, we’ve reached ‘peak tech’


Research from the 2016 Accenture Digital Consumer Survey reveals that consumer demand for new tech is stalling. Sales of smartphones, tablets and laptops are sluggish and demand for internet of things (IoT) enabled devices isn't growing fast enough to “offset


Accenture polled more than 28,000 consumers in 28 countries and found that 48% of people are planning to buy a new smartphone in 2016 compared to 57% last year.


Accenture Igniting Growth Consumer Technology Infographic Final.pdf


Click here for the full infographic.


In 2015, 38% of consumers had planned to purchase a new TV or tablet, this has now fallen to 30% for TVs and 29% for tablets.


As for IoT devices, consumers cite the expense (62%) and privacy fears (47%) as reasons for lack of adoption.


That being said, a surprising 8% of people plan to purchase a virtual reality headset in 2016. At least you’ll be able to clearly see which 8% of the population to avoid while walking down the street.


Apps more preferable for customer care


According to Contact Solutions’ Digital Disconnect report (registration required) a huge 75% of the 1,004 people surveyed said they’d rather use a mobile app for customer service because of their convenience.


Unfortunately 95% of apps force users to exit and transfer to a ‘live’ channel such as phone or live-chat.


A key revelation is that 53% of customers would spend more money with a brand if they could switch channels or devices to carry on their conversation and not have to repeat themselves.


Fewer native ads to run in 2016


According to a survey by Trusted Media Brands Inc on preferred mobile advertising formats, 45% of marketers say they’re going to use native ads in 2016, a dip of 5% from 2015. Marketers complain that native ads are hard to measure, not easy or quick to produce and the sell through rate for native, even for sites with a stated emphasis on the format can be 5% or less.


Mobile programmatic is taking off in the UK


According to the IAB, 50% of UK marketers are using programmatic for buying smartphone inventory.


  • Nearly 3 in 10 (29%) of respondents feel they have an “excellent” understanding of mobile advertising as a whole compared to 22% who said they had a “poor” level of understanding.

  • 79% of the respondents said that mobile advertising is an important part of their organisation’s overall advertising strategy.

  • Location based advertising is seen by 66% of respondents as the most exciting mobile opportunity, whilst 52% agree that wearable technology is an excellent opportunity for the industry.

  • 56% of respondents plan to start advertising on wearables in the next 12 months.


Brand activity on social leads to meagre sharing


According to a report published on Warc (registration required) only 7% of consumer actions in response to brand-related content on social takes the form of actually sharing the material.

Tania Yuki, Founder/CEO of social content analytics firm Shareablee, reported that:


From January to October 2015, US brands published 35m posts across Facebook, Twitter, and Instagram, sparking 65bn actions with social audiences (i.e., comments, shares, retweets, etc.) Yet just 7% of these actions involved sharing of a brand's content… despite what is increasingly recognised as the value of shared content for building brand equity.


Marketers failing to make the most of data


CMO Council’s Predicting Routes to Revenue report (registration required) reveals that despite the volume of data at marketers’ disposal, organisations are poorly equipped to offer a more personalised experience.


  • Only 5% of respondents could predict with confidence the customer journey and what actions could achieve maximum value.

  • 23% were able to develop predictive insights into broad customer trends

  • 20% felt they could only predict the next best action and struggled to move beyond that first step

  • 48% of respondents indicated that data is collected and analysed but remains separate and is not well aligned

  • Only 3% said their current data sources were integrated and totally aligned


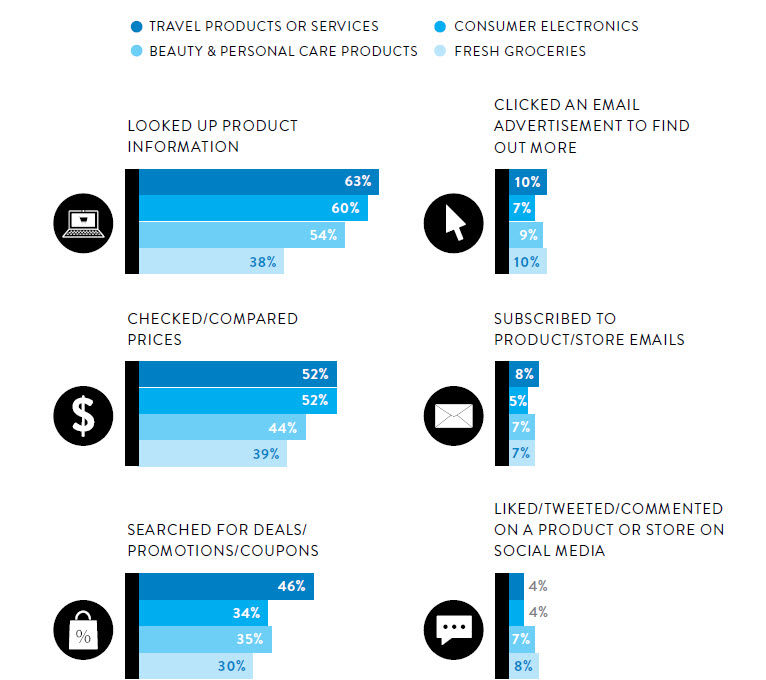
Information gathering and deal seeking are the primary online shopping activities


According to Nielsen, people are “less inclined to simply go to the nearest store [instead] they grab the nearest digital device.


And what is the primary use of a digital device? Research and bargain hunting, and it’s the travel sector which enjoys the most activity…


connected commerce


The report also reveals that 57% of respondents had purchased from an overseas ecommerce retailer in the last six months.


Google outpacing Facebook in spend growth


According to IgnitionOne’s Q4 2015 Digital Marketing Report (registration required), Google surpassed Facebook in growth and conversions, seeing an increase of 37% in programmatic display advertising spend and a 34% increase in conversions. Facebook saw an increase of 22% in growth and 17% in conversions.


The cost of Facebook ads experienced a drop, with eCPMs down -6% YoY. Whereas Google saw an eCPM growth of 16%. The report suggests this is largely down to fewer (but larger) ads being shown to users.


Technology, media & entertainment and retail industries most vulnerable from digital disruption


A report from The Global Center for Digital Business Transformation surveyed 941 business leaders around the world in 12 industries and surfaced several “troubling findings” in regard to businesses ability to adapt to digital transformation.


  • Survey respondents believe an average of four out of today’s top 10

    companies (in terms of market share) in each industry will be displaced by digital disruption in the next five years

  • Digital disruption is not seen as worthy of board-level attention in about 45% of companies (on average across industries)

  • 43% of companies either do not acknowledge the risk of digital disruption, or have not addressed it sufficiently.

  • Nearly a third are taking a “wait and see” approach, in hopes of emulating successful competitors

  • Only 25% describe their approach to digital disruption as proactive – willing to disrupt themselves in order to compete


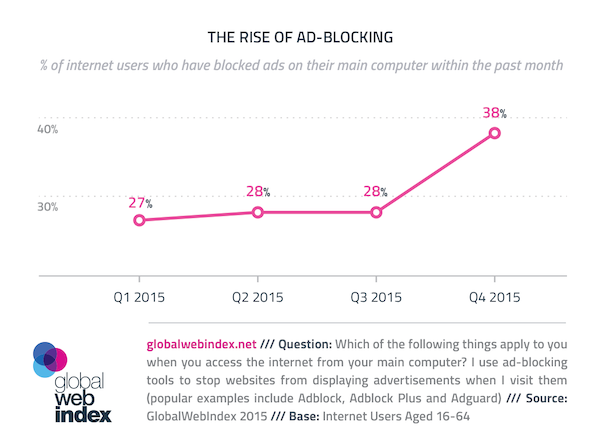
Ad blocking on the increase


Data from GlobalWebIndex (GWI) showed a 10 percentage point rise (from 28% to 38%) in the use of adblocking software in Q4 2015, after little movement in the first three quarters of the year.


rise of ad blocking chart


What's it Take to "Go Viral?" 11 Traits to Give Your Idea Wings

Posted by mattround

Before joining Distilled I worked for UsVsTh3m, an experimental Trinity Mirror project, where we created hundreds of games, quizzes and daft "toys." We had unprecedented freedom to try out new interactive formats, learning a great deal about what works… and what doesn’t.

The key to success was "viral" traffic. You’ve probably heard the term bandied about in reference to something popular, and might even have rolled your eyes; it’s a much-abused buzzword.

The idea is that online word-of-mouth can drive exponential traffic growth and broad media coverage with little or no traditional promotional support, but achieving this requires a certain way of thinking. This article focuses on interactive content, but many of the same principles will apply to other formats.

The viral life cycle

It’s useful to aim for interactive content to be…


  1. Clickable — When someone sees a link and description (on social media or a site), it seems compelling enough to take a look.

  2. Playable — The visitor sticks with it and finds it enjoyable or interesting.

  3. Shareable — There’s a strong urge to tell others, often involving the visitor sharing their individual result/score.

You usually need all three aspects to be strong to get a viral hit. It’s easy to focus on one, an experienced team can usually achieve two, but it’s difficult to consistently get the full set.

Crudely, you can think of it in terms of losing potential sharers, ultimately needing to end up with more than one to start the next cycle(s). This image explains it nicely:

Congratulations, it’s going viral! That’s a massive simplification, but a helpful one.

11 ways to make it shareable

1. Attributes

Develop a concept that ties in with the player’s personal attributes: age, location, abilities, personality, etc. For example, measuring reaction time in milliseconds is fine… but if you can correlate it with age, then you’ve immediately got something far more compelling.

2. Tribes

Reinforce a sense of belonging; tribes can be regional, generational, interest-based, political, etc. Perhaps play different tribes off against each other so that your interactive content can address niche groups while having broad appeal overall.

3. Insights

It tells you something about yourself or, more likely, confirms a flattering/intriguing attribute, leading into...

4. Humblebrags

Sharing to make yourself look good… but without it seeming too blatant.

5. “One more go…”

Ensure the player is hooked and will want others to share in that. Although bear in mind that the best games often aren’t the most viral — adding multiple levels and features to a game tends to put off non-gamers and can actually reduce sharing (enthusiasm has a chance to ebb away, and the game will tend to end on a low note when the player finally fails or quits).

6. Topical

People are impressed by fast-turnaround topical content, and sharing it can show you’re up-to-date (perhaps even the first in your social circle to discover something). We regularly developed and launched games in half a day at UsVsTh3m, and more than once within an hour. This obviously isn’t feasible for most commercial projects, but with more agile development and approval processes you can reduce lead times.

7. Delight

Overwhelm the senses: strong use of music, dance, animation, spectacular explosions, anything that’s a straightforward pleasure.

8. Competition

“Can you beat this score?”

9. Comparison

“I got this result, how about you?” This is much "softer" than direct competition and typically more welcoming for a broad audience.

10. Collaborating

Things like global counters, polls, or territorial maps can create the sense of playing your part in a bigger cause. Even just clicking something to increment a number can be made hard to resist with the right "cause."

11. Quality

It’s still possible for something to succeed simply by being good, but in the absence of any other aspects it’d better be really good. Knock-your-socks-off good.

Of course, all of the above overlap and interrelate, and it’s by no means an exhaustive list.

Telling the world

Something that’s strongly viral can actually just be exposed to a few hundred people via Twitter or Facebook. It won’t need a big push; the viral mechanism will ensure it spreads and attracts media attention.

It’s often useful to accompany a launch with relevant press material, perhaps teasing out key angles or supplementary content/data to suit each type of media outlet. Don’t force a story if there isn’t one, though; you don’t want to jeopardize later coverage based around “this cool thing is going viral.”

If the stats are showing it’s strongly going viral (this should be obvious within minutes), you’re then in the fortunate position of planning for success. Keep an eye out for initial coverage that may benefit from additional material, and look to do a follow-up press campaign at a suitable milestone (e.g. at X million visitors, or when you have interesting data to share), broadening the coverage.

If it’s not going viral, stop and consider whether minor changes to wording might make it more clickable. Look at whether it needs to break into a niche audience or broaden its appeal, and retarget accordingly. Although Twitter drives far less traffic than Facebook, it offers more freedom to experiment, target influential individuals, and re-promote over time. If a topical angle may arise, perhaps wait and be ready to repackage and relaunch at a moment’s notice.

Case studies: Two simple games that went viral

The North-o-Meter

UsVsTh3m’s North-o-Meter (sadly, this is currently broken due to hosting issues) used multiple-choice questions to guesstimate how Northern/Southern you are. Despite being entirely UK-focused, within just 4 days of launch it had 3.6 million visitors, 1 million Likes, 1.1 million comments on Facebook, and 41,000 tweets. It went on to get millions more visits, virtually saturating the potential audience. Countless similar quizzes had used this topic before, so why did this one make such a big impact?


  • It was clickable because the wording of tweets and Facebook posts worked well, teasing the Northern/Southern cultural identity element in a way that seemed intriguing and non-threatening.

  • It was playable thanks to working well on mobile (people were playing and comparing scores late into Friday nights down the pub), being easy to play and giving constant visual feedback, unlike many similar things that simply ape static magazine personality quizzes.

  • It was shareable by tapping into attributes (location/origin), tribes (north vs. south), insights (using mundane questions to infer something greater), competition, comparison, and quality (the visual feedback and often surprisingly accurate conclusions).

  • Northern/Southern cultural identity is immensely strong in the UK. It’s a key part of how many people define themselves.

  • The whole quiz was grounded in honest personal experience. One of our young journalists had written about moving to London, and the way it resonated with people led us to think about how to apply that to an interactive format.

  • Naming a specific place to go with the percentage meant it sometimes got the player’s location/origin spot-on, so they were then likely to share it in a very enthusiastic way.

How Old Are Your Reactions?

How Old Are Your Reactions?, produced by Distilled for JustPark, is a simple web game where you stop a car with a tap/click. Your reaction time is then used to look up the corresponding age for that score, based on a survey of 2,000 players.

Our thinking beforehand was that it would work well due to the following aspects:


  • It would be clickable by setting an intriguing personal challenge.

  • It would be playable thanks to clear, quick gameplay and good presentation, including full mobile compatibility.

  • It would be shareable due to attributes (age and reactions), insights (inferring age from reactions), humblebrags (impressively young age result), "one more go…" (few will play it just once), competition, comparison, and quality.

  • Age is a key personal attribute, and age estimation prompts a great deal of conversation and comparison, whether the result is accurate or lower/higher than the player’s actual age. Lively conversations on Facebook help ensure visibility.

  • Driving is a relevant, relatable way to dress the game up, particularly for this brand. A straightforward, bare-bones reactions test would have been "colder" and less engaging.

  • The combination of elements would allow for multiple storytelling angles in coverage, to do with good-natured rivalry between generations, road safety, etc.

This all seems to have been borne out by the stats since launch: Over 3 million unique page views, nearly 300,000 social shares, and links from over 400 domains.

In summary…

Always ask yourself:


  • How can we make it clickable, playable, and shareable? Judge your ideas harshly — you need all three.

  • Which sharing impulses can it tap into? It should be possible to readily pick out a few motivations, or refine the concept to strengthen this aspect.

  • What will be the best way to capitalize on success? Be ready to build a story around it, using popularity as the foundation for broad and varied coverage.

The way people share and interact is constantly changing, and reaching large audiences is always challenging, but the approaches I’ve outlined can help you to devise interactive content that’ll have a great shot at going viral.


Sign up for The Moz Top 10, a semimonthly mailer updating you on the top ten hottest pieces of SEO news, tips, and rad links uncovered by the Moz team. Think of it as your exclusive digest of stuff you don't have time to hunt down but want to read!